
County Profiles
Select your county from the drop down below or scroll down for the Washington State profile.
-
Washington Counties
Posted May 2025
April 2025 Highlights
From March to April, the not seasonally adjusted unemployment rate decreased from 4.5% to 4.2% and total nonfarm employment increased by 8,500.
Washington State Summary
The COVID-19 pandemic in 2020 swiftly and deeply impacted Washington’s labor market. During the brief recession, Washington employers shed approximately 430,000 jobs, and the unemployment rate reached a record high 14.2%.
Economic recovery was rapid and uneven. Total nonfarm employment reached pre-pandemic levels by summer 2022. Within that, some industries, such as information, recovered within months of the crisis. Others, such as manufacturing, have yet to reach pre-pandemic employment levels.
Over the past couple of years, rapid employment growth that characterized the post-pandemic recovery has slowed. Some industries, such as healthcare, continue to expand employment. Others, such as information and wholesale trade, have shed jobs over the past couple of years.
Geographic overview

Washington is in the Pacific Northwest region of the United States, neighboring Oregon to the south, Idaho to the east, British Columbia, Canada, to the north and the Pacific Ocean to the west.
Washington is part of the U.S. Bureau of Labor Statistics’ West region. It includes the following Metropolitan Statistical Areas (MSAs):
- Seattle-Tacoma-Bellevue MSA
- Seattle-Bellevue MD (part of Seattle-Tacoma-Bellevue MSA)
- Tacoma-Lakewood MD (part of Seattle-Tacoma-Bellevue MSA)
- Everett MD (part of Seattle-Tacoma-Bellevue MSA)
- Olympia-Lacey-Tumwater MSA
- Bremerton-Silverdale-Port Orchard MSA
- Mount Vernon-Anacortes MSA
- Portland (Ore.)-Vancouver (Wash.)-Hillsboro (Ore.) MSA
- Longview MSA
- Spokane-Spokane Valley MSA
- Kennewick-Richland MSA
- Walla Walla MSA
- Yakima MSA
- Bellingham MSA
- Wenatchee MSA
Visit the Bureau of Labor Statistics website for more about information about Washington.
Washington has 12 regional workforce areas overseen by Workforce Development Boards. Visit the Workforce Training & Education Coordinating Board website for information about the 12 regions.
Employment situation for April 2025
Labor force and unemployment
-
The not seasonally adjusted unemployment rate was 4.2% in April 2025, down from 4.5% in March and up from 4.1% observed 12 months ago.
-
The labor force decreased by 0.6% compared to April 2024, shedding 25,462 participants.
Unemployment rate, not seasonally adjusted
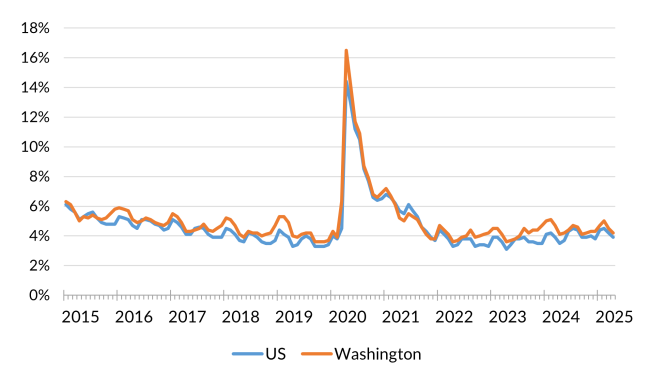
Source: Employment Security Department/Labor Market Information and Research (LMIR) Division, Local area unemployment statistics
Payroll employment
-
Total nonfarm employment increased by 8,500 from March to April 2025.
-
From March to April 2025, not seasonally adjusted employment increased for seven sectors detailed in this report and decreased for five. The largest increases were observed in professional and business services (up 4,500), private education and health services (up 3,600) and construction (up 3,000). The deepest one-month decreases were observed in financial activities (down 2,800), information (down 2,300) and transportation, warehousing and utilities (down 1,800).
-
From April 2024 to April 2025, total nonfarm employment increased by 1,200 or 0.03%.
-
Overall, employment in seven major industries expanded and six contracted over the year.
-
Employment in private education and health services increased to the greatest extent (up 11,800). Government, professional and business services and transportation, warehousing and utilities also increased employment significantly (4,200, 3,400 and 3,100 respectively). The largest decreases over the year were in goods producing sectors. Construction employment was down 6,000 and manufacturing was down 7,200 jobs.
Nonfarm employment estimates, not seasonally adjusted, Washington state
| NAICS Industry Title | Apr 2025 (Prelim) | Mar 2025 (Revised) | Apr 2024 (Revised) | Mar 2025 to Apr 2025 Change | Apr 2024 to Apr 2025 Change | Apr 2024 to Apr 2025 % Change |
|---|---|---|---|---|---|---|
| Total nonfarm | 3,625,100 | 3,616,600 | 3,623,900 | 8,500 | 1,200 | 0.0% |
| Total private (total nonfarm less government) | 3,002,600 | 2,996,000 | 3,005,600 | 6,600 | -3,000 | -0.1% |
| Goods-producing | 491,200 | 489,600 | 504,500 | 1,600 | -13,300 | -2.6% |
| - Mining and logging | 5,200 | 5,200 | 5,300 | 0 | -100 | -1.9% |
| - Construction | 217,900 | 214,900 | 223,900 | 3,000 | -6,000 | -2.7% |
| - Manufacturing | 268,100 | 269,500 | 275,300 | -1,400 | -7,200 | -2.6% |
| Service-providing | 3,133,900 | 3,127,000 | 3,119,400 | 6,900 | 14,500 | 0.5% |
| - Wholesale trade | 139,400 | 137,200 | 139,300 | 2,200 | 100 | 0.1% |
| - Retail trade | 329,600 | 331,100 | 331,100 | -1,500 | -1,500 | -0.5% |
| - Transportation, warehousing, and utilities | 151,500 | 153,300 | 148,400 | -1,800 | 3,100 | 2.1% |
| - Information | 163,300 | 165,600 | 162,800 | -2,300 | 500 | 0.3% |
| - Financial activities | 159,500 | 162,300 | 162,200 | -2,800 | -2,700 | -1.7% |
| - Professional and business services | 546,000 | 541,500 | 542,600 | 4,500 | 3,400 | 0.6% |
| - Private education and health services | 561,000 | 557,400 | 549,200 | 3,600 | 11,800 | 2.1% |
| - Leisure and hospitality | 337,600 | 335,600 | 342,800 | 2,000 | -5,200 | -1.5% |
| - Other services | 123,500 | 122,400 | 122,700 | 1,100 | 800 | 0.7% |
| - Government | 622,500 | 620,600 | 618,300 | 1,900 | 4,200 | 0.7% |
Note: Data benchmarked through December 2024, updated May 12, 2025.
Source: Employment Security Department/Labor Market Information and Research Division, Washington employment estimates (WA-QB & CES)
Detailed tables can be found on the source page in the third spreadsheet titled Current employment estimates, not seasonally adjusted.
Total covered employment
Washington has a diverse labor market with substantial local variation. Government is the largest sector in terms of employment, which includes federal, state and local government and activities ranging from administration to public education, public utilities, tribal enterprise and more. The largest private sector industries are healthcare and social assistance, retail trade and manufacturing.
Employment by industry, Washington state 2023 annual average
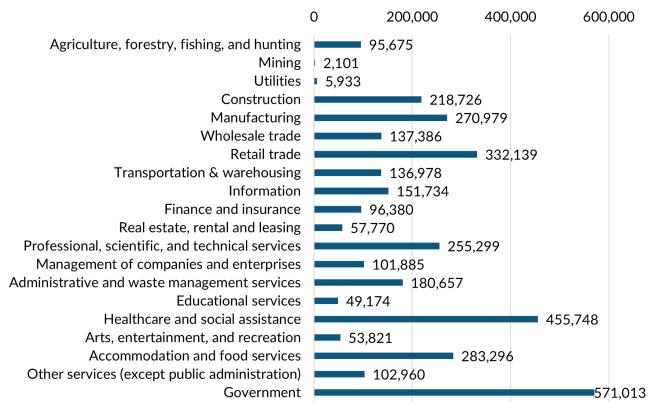
Source: Employment Security Department/Labor Market Information and Research (LMIR) Division, Covered Employment (QCEW)
Average annual covered employment in Washington was 3,559,653 and the average annual wage was $87,091 in 2023.
Top five sectors in terms of employment in 2023:
- Government (571,013)
- Health care and social assistance (455,748)
- Retail trade (332,139)
- Accommodation and food services (283,296)
- Manufacturing (270,979)
Wages can vary substantially from one industry sector to another.
Top five sectors in terms of average annual wage in 2023:
- Information ($251,234)
- Management of companies and enterprises ($212,551)
- Professional, scientific, and technical services ($143,303)
- Utilities ($128,822)
- Finance and insurance ($126,494)
Workforce demographics for Washington state
Age
| Total | Labor force participation rate | Unemployment rate | |
|---|---|---|---|
| 16 to 19 years | 365,567 | 40.20% | 16.60% |
| 20 to 24 years | 477,787 | 79.20% | 8.80% |
| 25 to 29 years | 566,940 | 84.90% | 5.10% |
| 30 to 34 years | 606,494 | 83.40% | 4.70% |
| 35 to 44 years | 1,092,809 | 83.30% | 4.10% |
| 45 to 54 years | 934,040 | 82.30% | 3.50% |
| 55 to 59 years | 460,694 | 74.60% | 3.80% |
| 60 to 64 years | 488,857 | 58.60% | 3.50% |
| 65 to 74 years | 772,064 | 24.80% | 3.60% |
| 75 years and over | 487,249 | 5.90% | 3.80% |
| Population 16 years and over | 6,252,501 | 64.70% | 5.00% |
| Population 20 to 64 years | 4,627,621 | 79.40% | 4.60% |
| Population 25 to 64 years | 4,149,834 | 79.50% | 4.10% |
Race and Hispanic or Latino origin
| Total | Labor force participation rate | Unemployment rate | |
|---|---|---|---|
| White alone | 4,394,285 | 62.30% | 4.70% |
| Black or African American alone | 241,312 | 69.70% | 7.40% |
| American Indian and Alaska Native alone | 69,995 | 61.00% | 8.10% |
| Asian alone | 613,005 | 70.10% | 3.50% |
| Native Hawaiian and other Pacific Islander alone | 41,512 | 69.40% | 6.10% |
| Some other race alone | 312,691 | 73.10% | 5.60% |
| Two or more races | 579,701 | 70.00% | 6.80% |
| Hispanic or Latino origin (of any race) | 742,087 | 72.90% | 5.90% |
| White alone, not Hispanic or Latino | 4,213,100 | 61.90% | 4.70% |
Sex
| Total | Labor force participation rate | Unemployment rate | |
|---|---|---|---|
| Male | 2,368,049 | 84.70% | 4.70% |
| Female | 2,259,572 | 73.90% | 4.50% |
Females with children
| Total | Labor force participation rate | Unemployment rate | |
|---|---|---|---|
| children under 18 | 779,573 | 71.90% | 4.30% |
| children under 6 only | 183,193 | 68.60% | 4.70% |
| children under 6 and 6 to 17 | 157,076 | 61.80% | 5.60% |
| children 6 to 17 only | 439,304 | 76.80% | 3.70% |
Poverty status over the past 12 months
| Total | Labor force participation rate | Unemployment rate | |
|---|---|---|---|
| Below poverty level | 430,738 | 45.00% | 22.10% |
| At or above the poverty level | 4,140,197 | 83.60% | 3.60% |
Disability status
| Total | Labor force participation rate | Unemployment rate | |
|---|---|---|---|
| With any disability | 501,627 | 50.60% | 10.00% |
Educational attainment
| Total | Labor force participation rate | Unemployment rate | |
|---|---|---|---|
| Less than high school graduate | 326,059 | 66.10% | 7.10% |
| High school graduate (includes equivalency) | 886,366 | 73.50% | 5.50% |
| Some college or associate's degree | 1,288,226 | 77.80% | 4.50% |
| Bachelor's degree or higher | 1,649,183 | 86.60% | 2.80% |
Source: U.S. Census Bureau, American Community Survey, S2301 | Employment Status
This workforce product was funded by a grant awarded by the U.S. Department of Labor's Employment and Training Administration. The product was created by the recipient and does not necessarily reflect the official position of the U.S. Department of Labor. The Department of Labor makes no guarantees, warranties, or assurances of any kind, expressed or implied, with respect to such information, including any information on linked sites and including, but not limited to, accuracy of the information or its completeness, timeliness, usefulness, adequacy, continued availability, or ownership. This product is copyrighted by the institution that created it. Internal use by an organization and/or personal use by an individual for non-commercial purposes is permissible. All other uses require the prior authorization of the copyright owner.